Summary
Banks cannot investigate every payment, so they use rules to decide which ones to flag, and every rule trades missed laundering against false alarms. I downloaded a synthetic anti-money-laundering dataset of about 5 million transactions from Kaggle, reduced it to a testable sample, explored it for laundering patterns, wrote five rules, graded each against the labelled outcomes, and put everything on a dashboard that refreshes with one click.
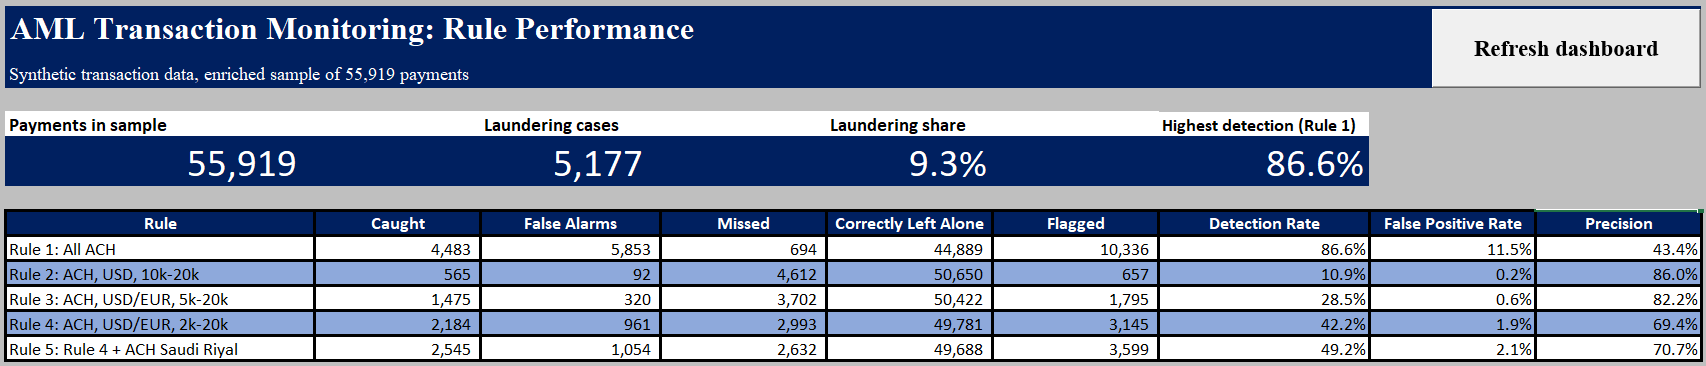
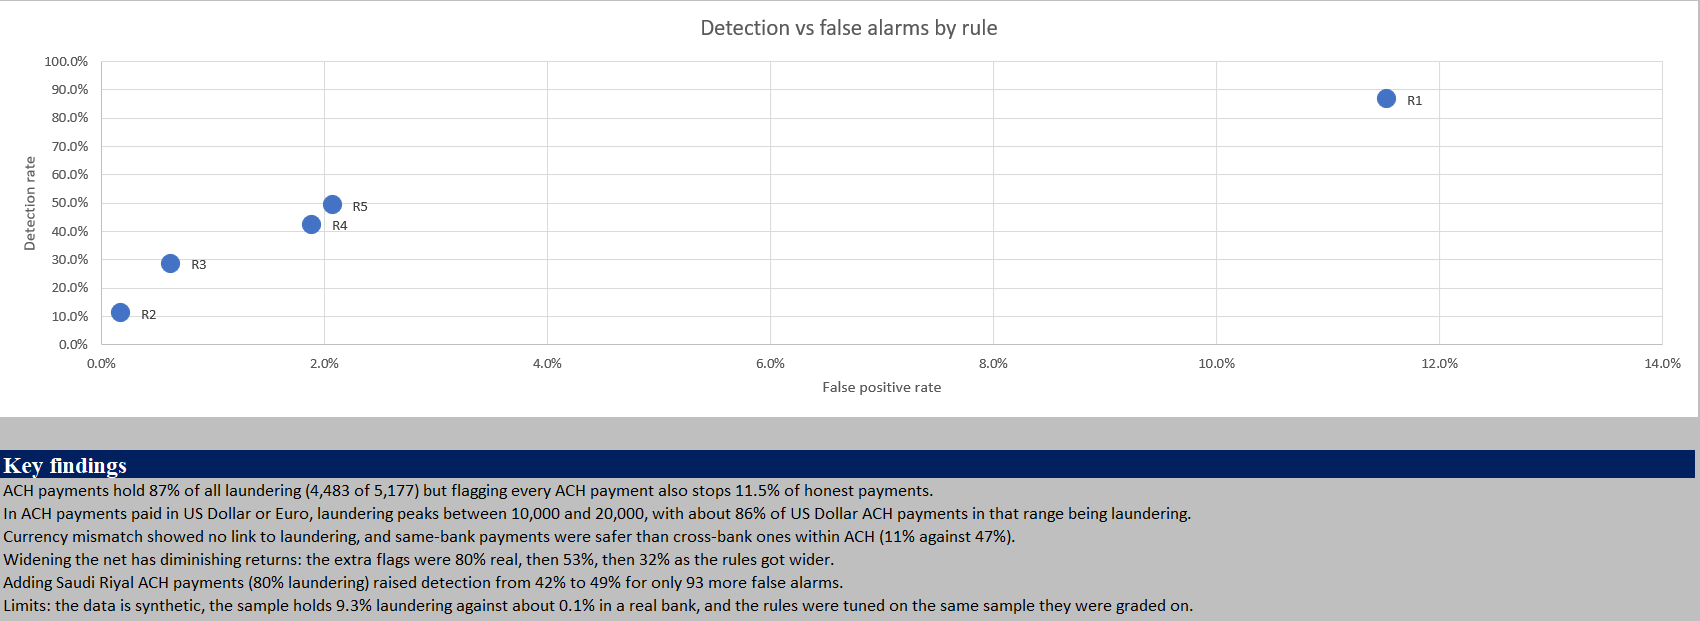
The main finding is the trade-off. Flagging every ACH payment catches 87% of the laundering but also stops 11.5% of honest payments, while narrower rules are far more accurate but catch much less, and each time I widened the net the extra flags were less likely to be real.
Request the workbook (macro-enabled Excel file)
The problem
A transaction-monitoring system flags suspicious payments for investigators to review. A good system must catch as much laundering as possible without drowning investigators in false alarms. This project builds a small version of that system and measures how well it works.
The data
I downloaded the synthetic dataset IBM Transactions for Anti Money Laundering (AML), published by IBM Research on Kaggle. The file was about 464 MB and held roughly 5 million transactions. Each row is one payment, with the banks, accounts, amounts, currencies, payment format and an Is Laundering label (1 for laundering, 0 for normal). The creators generated the laundering themselves, which is why every row is labelled. Real banks never have that label. I used it only to grade my rules, never to build them.
What I did, step by step
1. Loaded the data
I loaded the first 100,000 rows into Excel with Power Query to learn the tools. I checked the row count and that the bank codes kept their leading zeros (for example 010 and 03208), because codes like these must stay text and not turn into numbers.
2. Found a problem and fixed it
Only 5 of those 99,999 rows were laundering, far too few to test anything. I rebuilt the Power Query steps to read the whole 5-million-row file and keep every laundering transaction plus every 100th normal one. The result was 55,919 rows, 5,177 of them laundering (9.3%), and I confirmed the count by filtering the table and reading the row count in the status bar.
3. Explored the data with PivotTables
I looked for clues before writing any rules:
- Payment format. ACH payments hold 87% of all laundering (4,483 of 5,177), with a laundering rate of 43%. Wire and Reinvestment payments had none.
- Amounts. I compared US Dollar payments only, because amounts in different currencies cannot be compared. The laundering rate climbs from about 2.5% under 1,000 to about 43% between 15,000 and 20,000, then drops to under 10% above 20,000. Larger payments are not riskier.
- Overlap check. Of 584 laundering payments in the 10,000 to 20,000 US Dollar band, 565 were ACH, so the amount pattern mostly lives inside ACH. I kept the two clues together instead of counting them twice.
- Currency mismatch. None of the roughly 690 payments where the paid and received currencies differ were laundering. A dead end, recorded as a finding.
- Bank route. Within ACH, same-bank payments were far safer than cross-bank ones (11% laundering against 47%). I compared within each payment format, because Reinvestment payments (all same-bank, none laundering) would otherwise have distorted the overall figure.
- ACH by currency. Most currencies sat near 40%. Saudi Riyal stood out at 80%, but from only 454 payments.
- Euro check. The same amount pattern appeared in Euro ACH payments, which let me cover both US Dollar and Euro in one rule.
4. Wrote five rules
Each rule is an Excel formula in its own column that flags a payment 1 or 0, built only from information a bank would have: all ACH payments; ACH in US Dollar from 10,000 to 20,000; ACH in US Dollar or Euro from 5,000 to 20,000; ACH in US Dollar or Euro from 2,000 to 20,000; and the previous rule plus ACH payments in Saudi Riyal.
5. Graded every rule
I sorted each payment into four groups: laundering caught, honest payment wrongly flagged (a false alarm), laundering missed, and honest payment correctly left alone. A scoreboard built with COUNTIFS formulas then calculates three scores for all five rules automatically. Detection rate is how much of the laundering the rule catches, false positive rate is how many honest payments it wrongly flags, and precision is how many flagged payments are real.
6. Charted and built the dashboard
I plotted detection against false positive rate for each rule, then designed a one-page dashboard with key numbers, a linked scoreboard with data bars, the chart and a written list of findings.
7. Automated it
A VBA macro with a button refreshes every PivotTable, recalculates the scoreboard, and checks that each rule's four groups add up to all 55,919 payments, a reconciliation check like those used in compliance reporting.
Results
| Rule | Payments flagged | Detection rate | False positive rate | Precision |
|---|---|---|---|---|
| 1. All ACH | 10,336 | 86.6% | 11.5% | 43.4% |
| 2. ACH, USD, 10,000 to 20,000 | 657 | 10.9% | 0.2% | 86.0% |
| 3. ACH, USD or EUR, 5,000 to 20,000 | 1,795 | 28.5% | 0.6% | 82.2% |
| 4. ACH, USD or EUR, 2,000 to 20,000 | 3,145 | 42.2% | 1.9% | 69.4% |
| 5. Rule 4 plus Saudi Riyal ACH | 3,599 | 49.2% | 2.1% | 70.7% |
Rule 1 catches the most laundering (86.6%) but flags more than 10,000 payments and wrongly stops 11.5% of honest ones. The narrower rules are far more accurate, but the most precise of them catch only a fraction of the laundering, and the best balance, Rule 5, catches about half.
Key insight: diminishing returns
Widening a rule catches more laundering but also stops more honest payments, and the extra flags get less useful each time. As the rules widened, the added flags were 80% real, then 53%, then 32%. Flagging more is not a free fix, and the right rule depends on how many alerts an investigation team can review.
From alert to investigation
A flag is only the start of the work. In a bank, an alert goes to an investigator, who decides whether the activity has a legitimate explanation or must be escalated. This section shows how I would route alerts using the results above, and then walks through one flagged account from the dataset. The workbook itself stops at the flags, so this describes how I would use its output and is not something it automates.
How I would use each rule
| Rule | Precision | False positive rate | How I would use it |
|---|---|---|---|
| 1. All ACH | 43.4% | 11.5% | Too noisy to send straight to investigators, so I would use it only as one risk signal among others |
| 2. ACH, USD, 10,000 to 20,000 | 86.0% | 0.2% | High-priority queue, since there are few alerts and most are real |
| 3. ACH, USD or EUR, 5,000 to 20,000 | 82.2% | 0.6% | Standard review queue |
| 4. ACH, USD or EUR, 2,000 to 20,000 | 69.4% | 1.9% | Review when capacity allows, or when the account already has other alerts |
| 5. Rule 4 plus Saudi Riyal ACH | 70.7% | 2.1% | The widest balanced rule, best used to group alerts by account into a single case |
Example case from the data (synthetic)
The accounts and banks in this dataset are synthetic identifiers, so nothing here describes a real customer. The case below is account 808B1C350 at bank 19329.
- Ordinary activity. On 1 and 5 September 2022 the account received two payments from the same source, an ACH payment of 7,903.82 US Dollars and a cash payment of 4,022.66 US Dollars. Both are labelled honest, although my Rules 1, 3, 4 and 5 flagged the ACH payment, which is a false alarm of the kind the scoreboard counts.
- Funds in. Between 6 and 10 September it received 10 ACH payments in US Dollars from 10 different accounts at 10 different banks, between 3,483.11 and 18,927.02 each and about 132,565 in total.
- Funds out. About 16 hours after the last payment arrived, the account began sending money on. Between 10 and 14 September, in under four days, it made 12 ACH payments to 12 different accounts at 11 banks: nine in US Dollars (about 113,212 in total), two in Euros and one in Australian Dollars.
- Rule results. Of the 22 laundering payments on this account, Rule 1 flagged all 22, Rule 2 flagged 13, and Rule 5 flagged 21.
What would worry an investigator
- Money moved on quickly, within a day of the last arrival.
- Many unrelated counterparties on both sides: ten different senders and twelve different recipients, with none repeated.
- A sharp change from the account's earlier behaviour, from two ordinary payments from one source to a burst of payments from ten new ones.
- Money that arrived in US Dollars and left partly in Euros and Australian Dollars.
How I would handle it
- Group every alert on the account into one case, so the investigator reviews one account and not more than twenty separate payments.
- Compare the activity with what the customer is expected to do, using KYC information such as occupation, source of funds and expected turnover. This dataset holds none of that, so in a real bank the investigation would start here.
- Examine the counterparties: whether the senders and recipients are connected to each other or to the customer, and whether they appear in other cases.
- Screen the parties against sanctions, PEP and adverse media lists, and look at how the money moved through the account.
- Decide and record the decision. If there is no credible explanation, escalate to the money laundering reporting officer so that a suspicious activity report can be considered, with the timeline and the reasons written down. If there is one, close the case with the explanation noted.
What this shows about my rules
My rules judge one payment at a time, and Rule 5 flagged 21 of this account's 22 laundering payments. Yet the strongest evidence is the pattern across the payments, many senders in and many recipients out within days, and no single-payment rule can see that. This is the main weakness of the current approach, and the clearest next step is account-level rules, such as the number of different counterparties in a short window, followed by network analysis. The pattern resembles an account used to collect and then pass on funds, but I found it by examining labelled data after the fact, not because my rules were designed to target it.
Limitations
- The data is synthetic, so patterns like the drop above 20,000 probably reflect how the simulation was built and would not appear in a real bank.
- The sample is enriched with laundering (9.3% against about 0.1% in real banks), so precision would be much lower in practice. Detection and false positive rates remain valid.
- I tuned the rules on the same sample I graded them on, which flatters the results. A stronger version would build the rules on half the data and test them on the other half.
Next steps
Next, I plan to add account-level rules, such as counting the different counterparties an account deals with in a short window, to test the rules on data they were not built on, and to rebuild the analysis in SQL with a Power BI dashboard.